Back
Do I Care About Lyrics?
01 Background
I love listening to music. I enjoy hearing beautiful melodies, exquisite
sound design, and out-of-the-box production techniques that make music
interesting.
However, I find that I don't always pay attention to the lyrics.
Whenever I listen to music with friends, I often find that they would be
quick to point out a lyric in a song that may stand out, whether it be
good or bad.
My response to this would usually be me not even realizing it was in the
song in the first place! 🤷♂️ Because of this, I decided to analyze my
Spotify stats to see if it actually reflects my tendency to not care
about lyrics.
02 Fetching Top Tracks from Spotify
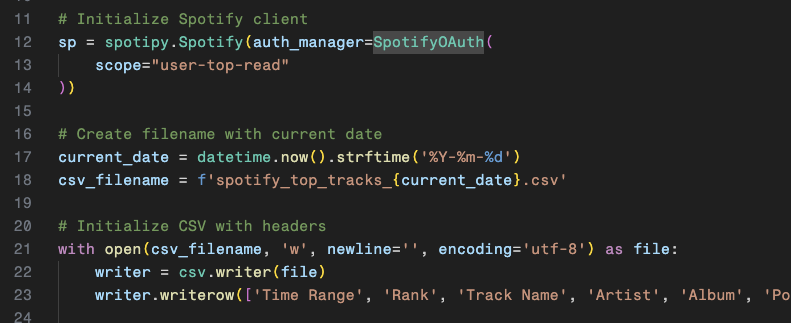
I used the Spotify API to access my listening history. After signing up for an API key at the Spotify for Developers page, I was able to use Spotipy to access my top artists, top tracks, and metadata for each song.

Top tracks are stored in three separate ranges, short-term (4 weeks), medium-term (6 months), and long-term (all-time).

I decided to store all of this data in a .csv file so that my main comparison for data analysis would be between the time ranges.

03 Fetching Lyrics from Genius
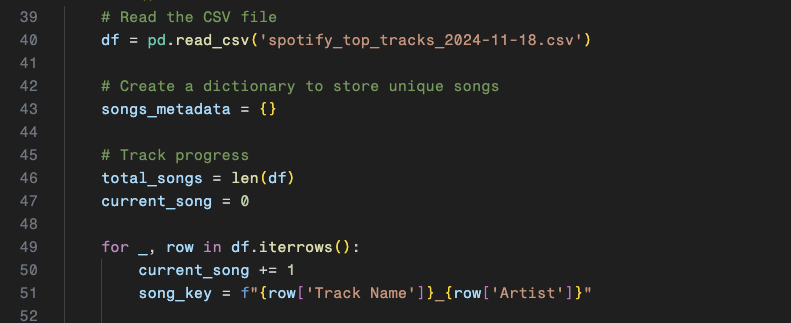
Now that I have all of my top tracks, I need to fetch the lyrics of each song. I decided to use LyricsGenius for this, as I can easily match the metadata from the .csv file to quickly obtain all of the lyrics.

Just like Spotipy, all I needed to do was sign up for an API key. From there, I was able to save all of the lyrics in a .json file.

04 Lyrical Analysis
Scraping Spotify and Genius was the easy part; now comes the lyric
analysis. My main three metrics to decipher if I care about lyrics or
not were:
Q01: How much of what I listen to is just repeated / barebones
lyrics? (Line Repetition)
Q02: How much of what I listen to
contains complex verses? (Verse complexity)
Q03: How much of what
I listen to contains unique words? (Word diversity)

A01: Lyric repetition was calculated by splitting the lyrics into lines
and simply counting if the lines were repeating.
A02: Complex verses were analyzed in each song by counting how many
unique verses exist.
A03: Unique words were calculated by finding
the ratio of how many times a word appears and comparing it to the all
of the words.
05 Data Visualisation
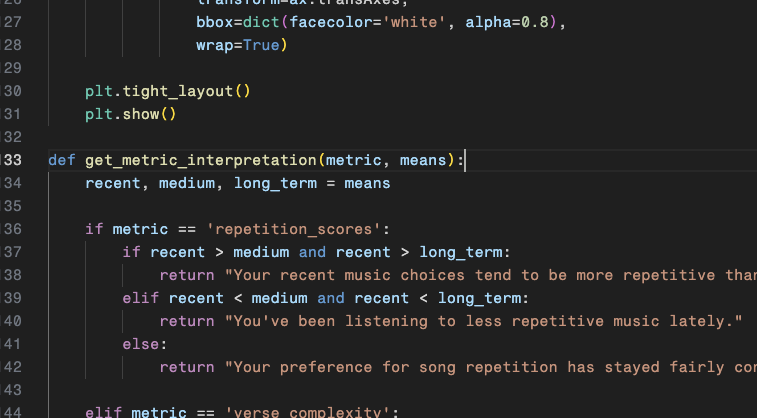
Now that the lyrics were analyzed, it's time to visualise the data. I mainly used Matplotlib to visualise the data, opting to maximise readability by creating bar charts for each listening range. I even decided to display metric interpretations depending on how each range compares to each other.

06 Analysis Results
With everything setup, it was finally time to display the data! All I had to do was run my python program to analyze the lyrics. The output was three graphs generated by Matplotlib, and the results ended up surprising me...

Comparing my overall top tracks with my recent top tracks, I can see that my overall listening habits have gravitated towards my subconscious caring for lyrics. I've been listening to less repetitive and more complex songs, albeit with a lot less vocabulary diversity, which is what surprised me most.
07 Experience & Findings
This project was a fun way for me to combine my passion of music along with coding and data visualisation in order to try and find introspective answers to how my listening to music has changed over time. I learned a lot about using different API's in conjunction with each other along with file creation between them. Furthermore, I learned even more about how to analyse and visualise data to align it with my own criteria and present it in a way that is easy to understand Moving forward, I'd like to try and refine my methods of analysing data in comparison with a set criteria. I'd also like to explore more ways in improving how I can visualise data, specifically with more eye-catching models and interactivity.